DIY Liquid Color Sensor
Build a calibrated liquid color sensor, track changes over time and get alerts.
This post is about reading the color of a liquid sample with a DIY Rig. The Python scripts I’m sharing here can be ran on your own or you can run them as part of a Krill Swarm using Krill Server Krill can alert you if a reading falls within a color range or a conversion to ppm or pH goes out of bounds.
A Reusable Rig for Reading Liquid Color
This post is the hardware foundation for a series of projects that read the color of a liquid sample — aquarium test kits, pH indicators, titrations, hydroponics, water quality, fermentation, even coffee extraction. The rig is a TCS34725 color sensor, a bright white LED backlight, a 3D-printed test tube holder, and a small set of Krill Lambda scripts that handle calibration and reading.
Future posts will bolt specific applications on top of this — logging API freshwater test kits, building per-kit calibration curves, cross-validating a CO2 drop checker against an Atlas Scientific pH probe — but those all depend on getting this rig right first. Everything below is the stuff I’d want to know before spending filament on a print.
⚠️ CRITICAL: For educational purposes only. This is a hobbyist instrument, not a lab-grade colorimeter. Don’t make irreversible chemistry, medical, or life-safety decisions based on its numbers.
What It Is
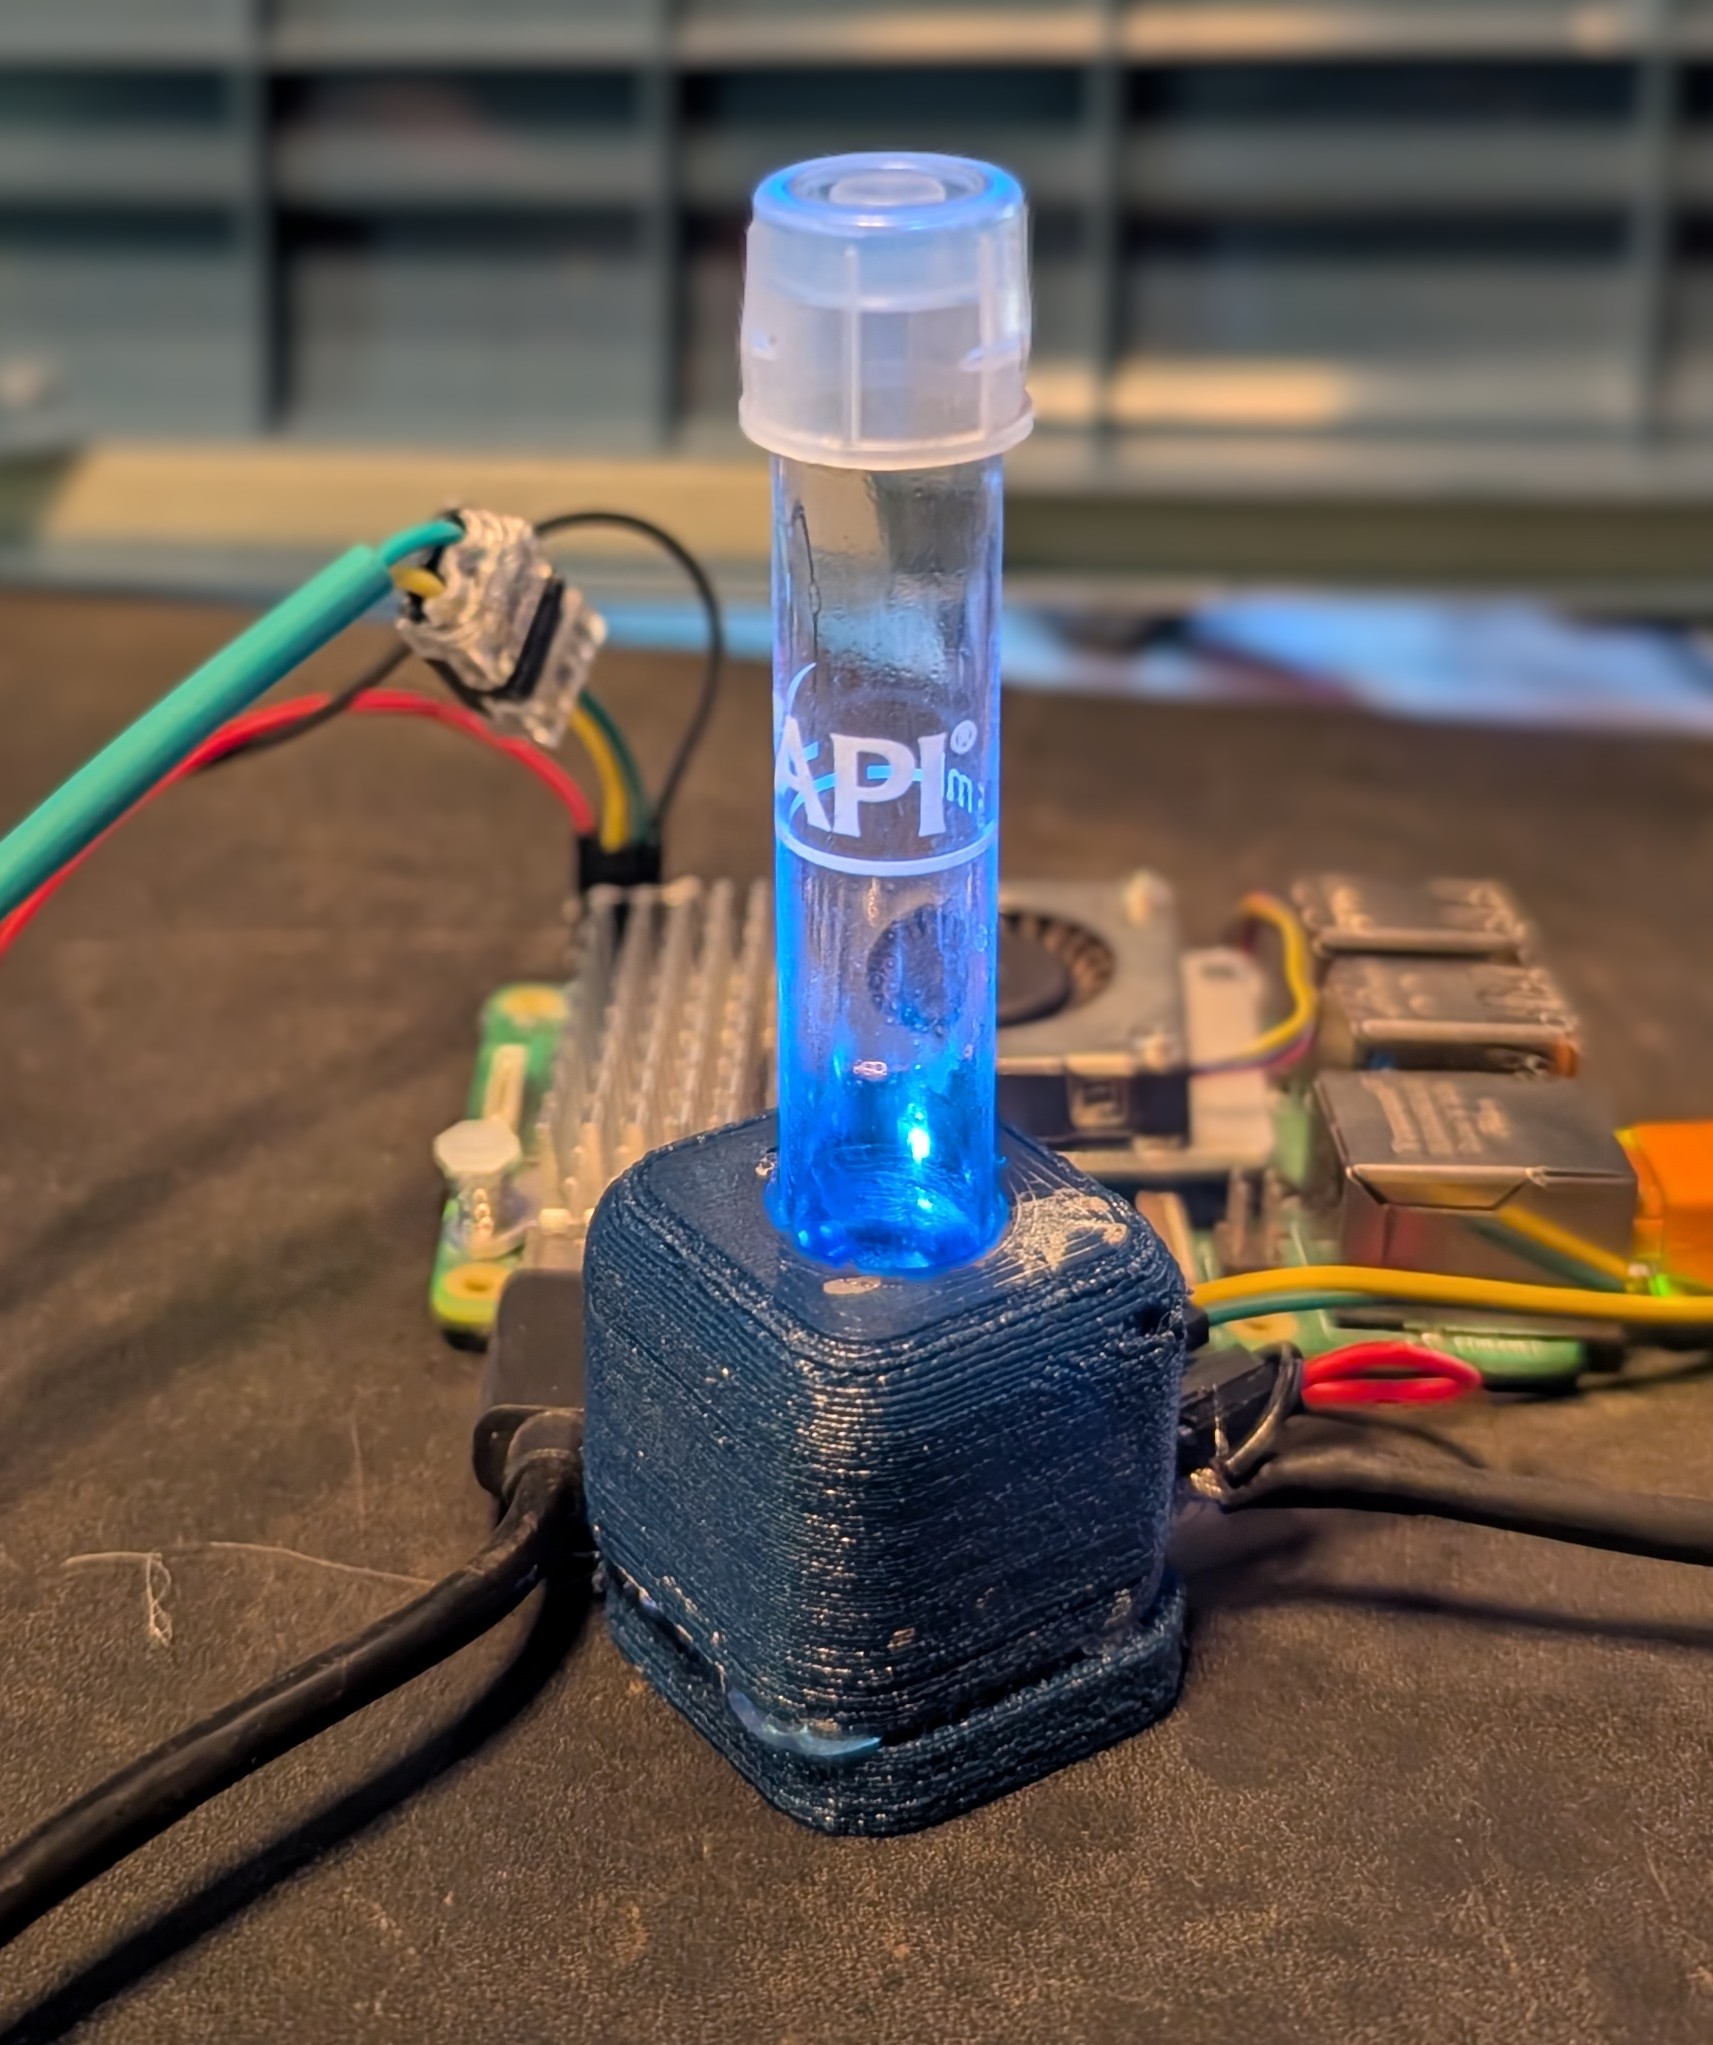
A small enclosed chamber with three things mounted inside: a test tube, a white LED on one side, and a TCS34725 color sensor on the other. The LED shines through the tube; the sensor measures how much of each color channel makes it through. When the liquid is clear, most of the light passes. When the liquid is tinted, certain wavelengths get absorbed. The difference between “clear” and “tinted” is the signal.
This is the same operating principle as a commercial colorimeter or spectrophotometer — a light source, a sample, a detector. The expensive bits of a lab instrument are the monochromator and the PMT; the cheap version uses a broadband LED and a three-channel filtered photodiode. You give up a lot of accuracy but you keep the geometry, and the geometry is what matters for the kinds of problems hobbyists actually want to solve.
Parts
- TCS34725 breakout (Adafruit 1334 or any clone). I2C, 3.3V logic, has an onboard white LED we will intentionally disable.
- Bright white through-hole LED + 120Ω resistor for ~25mA at 5V. A standard 20,000 mcd white LED works. Brighter isn’t better (more on this below).
- A 3D-printed holder for the sensor, tube, and LED. STL on Makerworld. PET-G or PLA both fine. Print it in black, or spray the interior with flat black matte paint after printing.
- A test tube — I use the ones from API freshwater test kits (clear plastic, ~13mm diameter). Glass works too. Whatever you use, pick one and never swap to a different size or shape without recalibrating.
- A Raspberry Pi running Krill Server with I2C enabled and the CircuitPython Lambda setup complete.
- Short I2C jumpers — under 15cm if you can manage it, to keep bus contention from showing up as mysterious read errors.
Getting the Hardware Right
Most of my debugging on this project was physical, not software. If you want stable readings, these four things matter more than any amount of clever math downstream.
Disable the sensor’s onboard LED
The TCS34725 breakout has a bright white LED built in, positioned for reflectance geometry — light bounces off a target in front of the sensor and comes back. That’s the wrong mode for liquid samples, where you want transmittance geometry — light passes through the sample and out the other side. Leaving the onboard LED on fills the enclosure with light that never interacted with your sample, which scatters off the walls, hits the sensor from random angles, and completely swamps the signal you actually care about.
Tie the LED pin to GND on the breakout (there’s a solder jumper or a dedicated pin depending on the clone). You’ll immediately see readings make more sense.
Use transmittance geometry
The LED goes on one side of the test tube. The sensor goes on the other. Light travels in a straight line through the sample and into the sensor face. That’s it. No reflectors, no diffusers, no light pipes — those all introduce geometry-dependent variations that calibration can’t remove.
Black interior, not white
My first print was white PET-G. The readings worked, but they were noticeably less sensitive to small color changes than I expected. The reason: white walls reflect stray light back onto the sensor, adding a geometry-dependent offset that doesn’t scale linearly with sample concentration. It’s the same reason lab instruments always have a black sample chamber — you want every photon the sensor counts to have passed through the sample, not bounced off a wall.
Flat black matte spray paint on the interior is enough. Don’t use gloss black; gloss has specular reflections that are actually worse than matte white. You can also print in black filament if you have it on hand.
Mechanical rigidity is everything
This was the single biggest accuracy lever I found. With the sensor slightly loose in its seat, tilting it a few degrees changed my clear-channel reading by 60% on the same tube of distilled water. The ratios between the R, G, and B channels stayed roughly constant (which is actually great news — absorbance math is ratio-based and survived), but the absolute readings were useless.
Things that help:
- Index the sensor on three points, not a loose pocket. The TCS34725 breakout has mounting holes — design around those. A friction-fit slot with a snap tab is far better than a generic rectangular cavity.
- Seat the test tube on its rim, not its body. Test tubes are slightly tapered and vary along their length. If the holder grips the body, the tube can sit at slightly different heights between inserts. If it bottoms out on the flared rim at the top, it’s always at the same depth.
- Mount the LED and the sensor to the same rigid subframe. If they’re on separate parts of the enclosure, any flex between them changes the effective path length. Both should reference the same internal frame.
- Strain-relieve the I2C cable. PET-G creeps under load over weeks. If the jumpers pull on the breakout, the breakout slowly tilts. Route the cable through a channel or tie it down.
LED choice and brightness
Counter-intuitively, dimmer is not better. The sensor has a roughly constant noise floor in absolute counts (shot noise, dark current, ADC noise). Your signal is whatever fraction of the light the sample absorbs. If you dim the LED by half, you halve the signal but the noise stays the same — so signal-to-noise gets worse, not better.
The correct pecking order for clean readings is: bright, steady LED → long integration time → minimum gain needed to stay in range. A 25-30mA white LED driven at 5V through a 120Ω resistor is a good starting point. More current isn’t harmful up to the LED’s max rating, but past a certain point you’ll saturate the sensor at its lowest gain setting anyway.
Critically: leave the LED on continuously. White LEDs shift output meaningfully in the first 30-60 seconds after power-on as the die heats up — both total brightness and spectral balance change. If your Lambda pulses the LED on just before each read, calibration captures one equilibrium and reads capture another. 150mW continuous is nothing for a plugged-in Pi rig, and LED lifetime is actually better with steady thermal state than with thermal cycling.
A word on white LEDs and color
White LEDs are actually blue LEDs with a yellow phosphor coating. Their emission spectrum has a huge spike around 450nm and a broader, weaker yellow-orange hump — not balanced white light. Your raw blank readings will be heavily blue-biased:
1
2
My rig, distilled water, gain=4, integration=400:
  R: 4300    G: 6450    B: 8640    C: 21545
You can see in those numbers that blue is twice as strong as red. That’s not a malfunction — the sensor is correctly reporting a blue-biased illuminant. White-balancing against a blank reference reading removes this bias entirely, which is why calibration matters.
The Software Pipeline
The goal is two outputs from one rig:
- A color swatch — an honest RGB rendering of what’s in the tube that a human can glance at in the Krill app.
- A blank reference — a stored baseline that downstream scripts (ppm lookup, absorbance computation, whatever) consume as a starting point.
Three Lambda scripts handle this. All source available in the Krill cookbook: krill-oss/cookbook/color sensor.
graph LR
    A[calibrate.py] --> B[calibration DataPoint<br/>DataType.JSON]
    B --> C[read_test.py]
    C --> D[sample_color DataPoint<br/>DataType.COLOR]
    B --> E[your downstream script]
    E --> F[...ppm, absorbance, etc.]
calibrate.py — capture the blank
The user puts a tube of distilled water in the rig and clicks the Lambda node. (Lambda nodes are clickable — no separate Button node needed.) The script auto-ranges the sensor’s gain and integration time to land the clear channel comfortably in the usable range, then burst-averages 10 reads for a stable blank.
The output is JSON stored in a DataType.JSON DataPoint:
1
{"r": 4300.7, "g": 6447.6, "b": 8636.2, "c": 21541.8, "gain": 4, "integration_time": 400}
Notice that gain and integration_time travel with the blank. That matters — any downstream script that reads the sensor has to use the exact same settings, or the blank reference is meaningless. Storing them together keeps the pipeline self-describing.
Two hard-won details baked into this script and worth understanding:
sensor.color_rawnotsensor.color. The.colorproperty returns 8-bit normalized values (0-255) that hide most of the information..color_rawreturns 16-bit channel counts (0-65535) where the signal actually lives.- The first read after changing gain or integration_time is stale. The sensor pipelines integrations — the registers hold values from the previous settings until a fresh integration completes. Always discard one read after changing config. At long integration times a defensive second discard helps.
Source: calibrate.py
read_test.py — live color swatch
This script pulls the calibration DataPoint as its Lambda source, samples the sensor at the calibration’s stored gain/integration_time, white-balances each channel against the blank, and prints a packed 24-bit RGB integer that the COLOR DataPoint renders as a swatch in the app.
One design choice worth calling out: the script does chromatic amplification before packing the output. After white-balance, a near-neutral sample has all three channels at roughly 1.0 and would display as near-white. That’s technically correct but visually useless — a user can’t tell “mostly clear” from “slightly tinted” at a glance. The script subtracts the minimum channel (the achromatic floor — how much light the sample transmits overall) and rescales the residual so the dominant hue peaks at 255. The swatch now looks yellow or green or pink, not off-white, which matches what a human sees when they look at the tube against a card.
Truly neutral samples (genuinely clear liquid, or no tube inserted) have ~zero channel spread and fall back to a plain grayscale rendering, so sensor noise doesn’t get amplified into arbitrary colors.
Source: read_test.py
colorkit.py — shared helpers for downstream scripts
Any future script that wants to do something quantitative with the rig — ppm lookup, absorbance, a custom metric — needs the same setup plumbing: parse the Krill source argv, load the blank, configure the sensor, burst-average, white-balance. colorkit.py packages all of that as run_test(tag, curve) so per-application scripts are tiny.
A concrete example from a future post:
1
2
3
4
5
6
7
8
9
10
11
# ammonia.py — 10 lines
from colorkit import run_test

CURVE = [
    ((1.00, 1.00, 0.20), 0.00),
    ((0.80, 1.00, 0.22), 0.25),
    ((0.50, 1.00, 0.30), 0.50),
    # ... more reference points
]

run_test("ammonia", CURVE)
The helper handles argv parsing, sensor sampling, white-balance, and piecewise-linear interpolation along the supplied curve in RGB-ratio space. The per-application script just supplies its reference data.
Source: colorkit.py
Krill Wiring
The full setup in the Krill app:
- DataPoint
calibrationwithDataType.JSON - Lambda
Calibrate— scriptcalibrate.py, targetcalibration - DataPoint
sample_colorwithDataType.COLOR - Lambda
Read Color— scriptread_test.py, sourcecalibration, targetsample_color - CronTimer — every 30 seconds, executes the Read Color Lambda
Workflow:
- First time: put distilled water in the tube, click the Calibrate Lambda once. Takes about 5 seconds.
- Ongoing: put any sample in the tube; the cron fires every 30 seconds and the swatch in the swarm view updates to match what’s in the tube.
- Recalibrate any time: new LED, cleaned the enclosure, noticed drift, swapped tube brand. Distilled water back in, click Calibrate, done.
Gotchas (Write These Down)
These are the things that cost me the most debugging time on this rig. In rough order of pain.
Don’t have two Lambdas reading the same I2C sensor on overlapping crons. The TCS34725 will serve both, but the reads will stack integrations and return wildly inflated values — or just time out for 30+ seconds. If you’re iterating on a new read script while an old Lambda is still firing every 5 seconds, you’ll chase phantom bugs for hours. Disable or delete the old one before testing new ones. I learned this the slow way.
Saturation at 65535 is invisible. If your clear channel reads exactly 65535, it’s clipped — your actual light level is higher than that, you just can’t measure it. Any math that divides by the blank silently produces bogus numbers. Auto-ranging at calibration time prevents this; targeting 60-85% of max leaves headroom for samples that come in brighter than the blank (rare, but possible with noise).
First read after changing gain or integration_time is stale. The sensor pipelines integrations. Always
sensor.color_rawonce and throw it away after changing config. At long integration times, discard twice.
Geometry drift swamps every other error. A slight tilt moved my clear channel by 60% on the same tube. Design the enclosure to index sensor and tube at fixed positions. Wiggle equals drift.
Keep the LED on continuously. LED output drifts for 30-60 seconds after power-on. Just leave it on.
White enclosure walls introduce non-linearity. Stray reflections add a geometry-dependent offset that doesn’t scale with sample color. Use flat black matte paint inside the enclosure.
PET-G is slightly translucent at thin walls. Ambient light leaks through walls under ~2mm into the sample chamber. For a rig in a room with variable lighting, this causes slow baseline drift. Thick walls or a dark outer shell solves it.
Long I2C jumpers cause random retries. Under 15cm is fine with stock pull-ups. Longer than that and you’ll see intermittent read errors. If you need longer runs, add 2.2kΩ pull-ups on SDA and SCL.
Why Not Just Use RGB Directly?
You can skip calibration and interpret raw sensor.color values directly for simple binary decisions — “is the CO2 drop checker blue or yellow-green?” works fine that way. The CO2 Reactor post does exactly this.
But the moment you want to distinguish between tinted samples — 0.25 ppm ammonia vs 0.5 ppm, or “drifting toward yellow” vs “already at yellow” — raw RGB stops working. The blue-biased LED compresses red-channel resolution, enclosure geometry shifts the baseline, and any change in the rig (new LED, sensor aged a few months, different tube) invalidates your thresholds. Calibration-against-blank fixes all of this in one move, and it’s cheap enough to do once per install and once per reagent bottle.
Upgrade Path: AS7341
The TCS34725 has three broad color filters (R, G, B) plus a clear channel. That’s fine for rough color discrimination but struggles with adjacent concentrations on a test kit card — 0.25 vs 0.5 ppm ammonia look nearly identical to RGB because three broad channels can’t resolve close points on a yellow progression.
The AS7341 has eight narrow-band visible channels plus clear and NIR. Krill-side it’s nearly drop-in — same I2C bus, same Lambda pattern, same calibration approach — except the “color” primitive shifts from a packed RGB int to a spectral vector stored in a JSON DataPoint. I’ll cover that in a future post when I have real side-by-side data.
For most of what I want to do with this rig, the TCS34725 is enough. Start there.
The Source Code
All scripts in the krill-oss cookbook:
calibrate.py— auto-ranging blank captureread_test.py— white-balanced color swatch for the appcolorkit.py— shared helpers for per-application scripts
Related
- CircuitPython Sensors via Lambda — installing Adafruit Blinka, enabling I2C, writing Lambda scripts that read I2C sensors
- Color Data Points and Triggers — the COLOR DataType used for the swatch, and the Color Trigger for RGB-range automation
- Lambda Executor — how Lambda source/target wiring works
- CO2 Reactor with Color Sensor — binary-decision use of the same rig
Draft — last updated 2026-04-26