Tracking Planted Aquarium Water Quality
Logging water-test colors over time with a Raspberry Pi color sensor for aquarium and water-quality monitoring.
This is part one of a series introducing the capabilities of the Krill Platform, using my freshwater planted aquarium as an example. We’ll start simply by manually logging the color of test kit samples, then go further by building a custom color sensor rig, creating reminders and alerts, and even connecting Claude to help interpret results and create dashboards.
If you have a Debian-based server such as a Raspberry Pi running Raspberry Pi OS or Ubuntu, you can install the Krill Server and start logging data in minutes.
In this post, I’ll share how to record colors that change over time — in this case, the color of water test kit samples. Once the Krill Server is installed and you run any of our apps or open the web interface (https://servername.local:8442) on the same network, the server will appear on the screen automatically.
What will really surprise you, as you explore the platform, is how many capabilities exist beyond this — such as a Claude Krill Skill and MCP server that connects to the power of LLMs for interpreting data, creating dashboards, and even writing code to interact with your project.
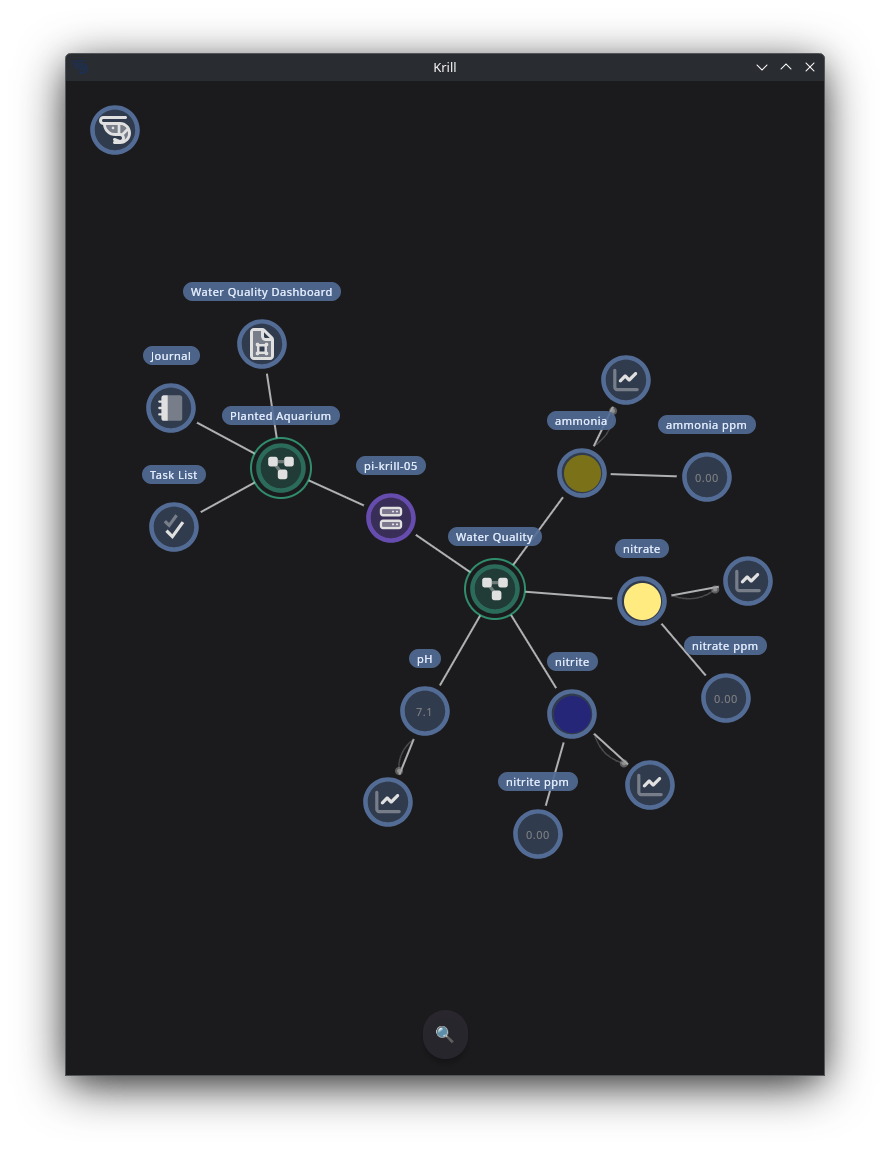
Krill works by adding “nodes” to a server. Each node can have multiple children, grandchildren, and so on, each with a single capability.
Here I set up two projects: one to log water quality test results and track pH, and another as a journal and task list for reminders to test the water and perform water changes.
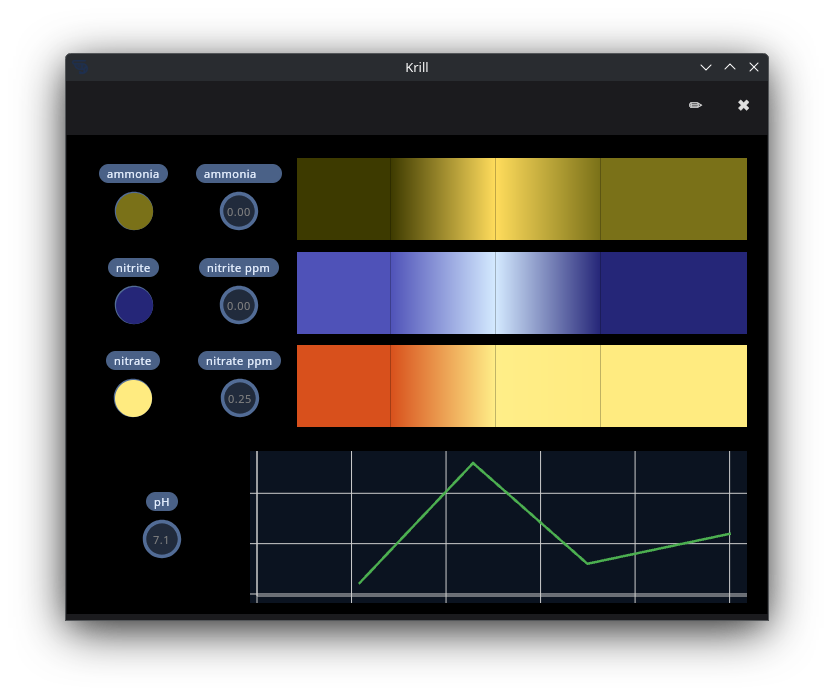
You’ll also see an SVG Dashboard that I created — I’ll talk more about that below. You can create dashboards to get clean, live views of your data instead of looking at the raw swarm screen:
To create color-based data points, click on the project and use the avatar menu to create a data point. Set the data type to COLOR and then use the color picker to set the color:
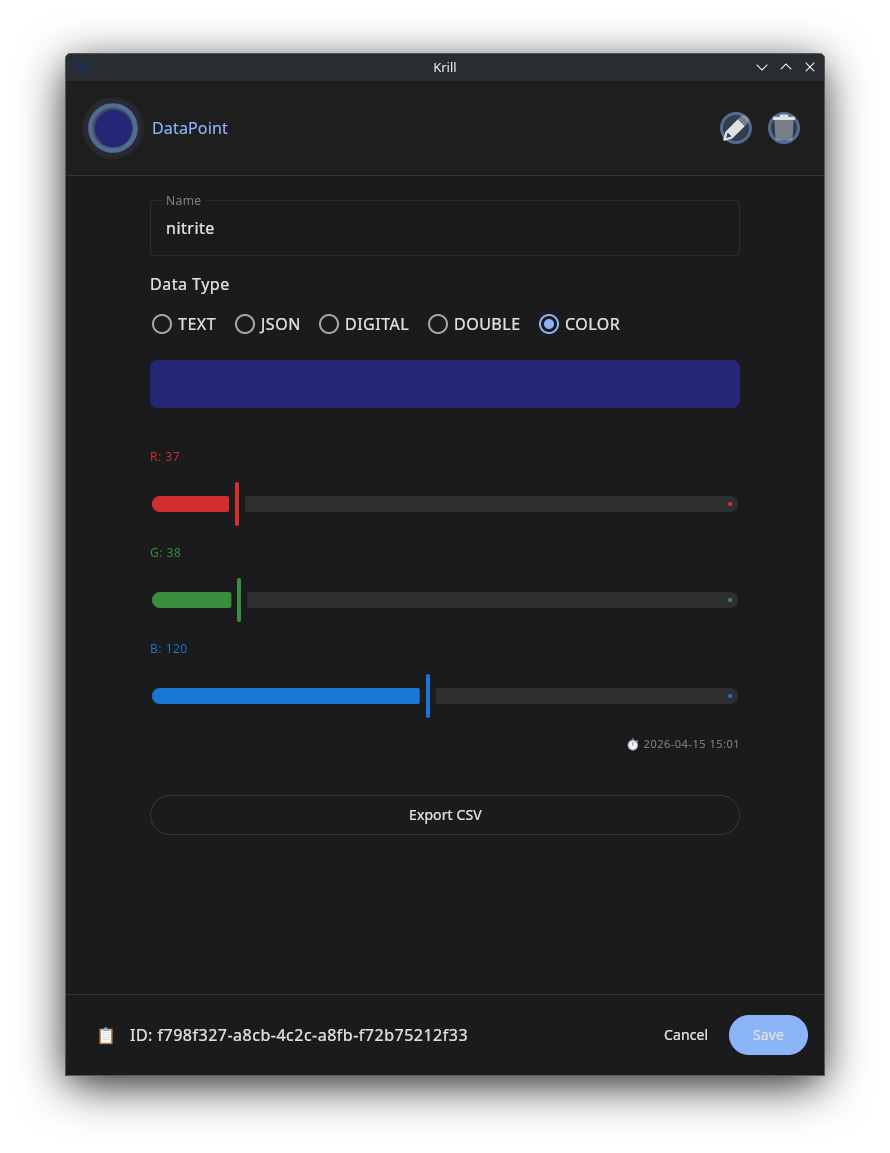
Congratulations — you now have a data point ready to log color data! You can click the color swatch to edit the color and view the history of changes over time. If you just want to track your test results manually, simply click the swatch and update the color each time you test the water, and you’re done! The color history lets you see how water quality has changed over time.
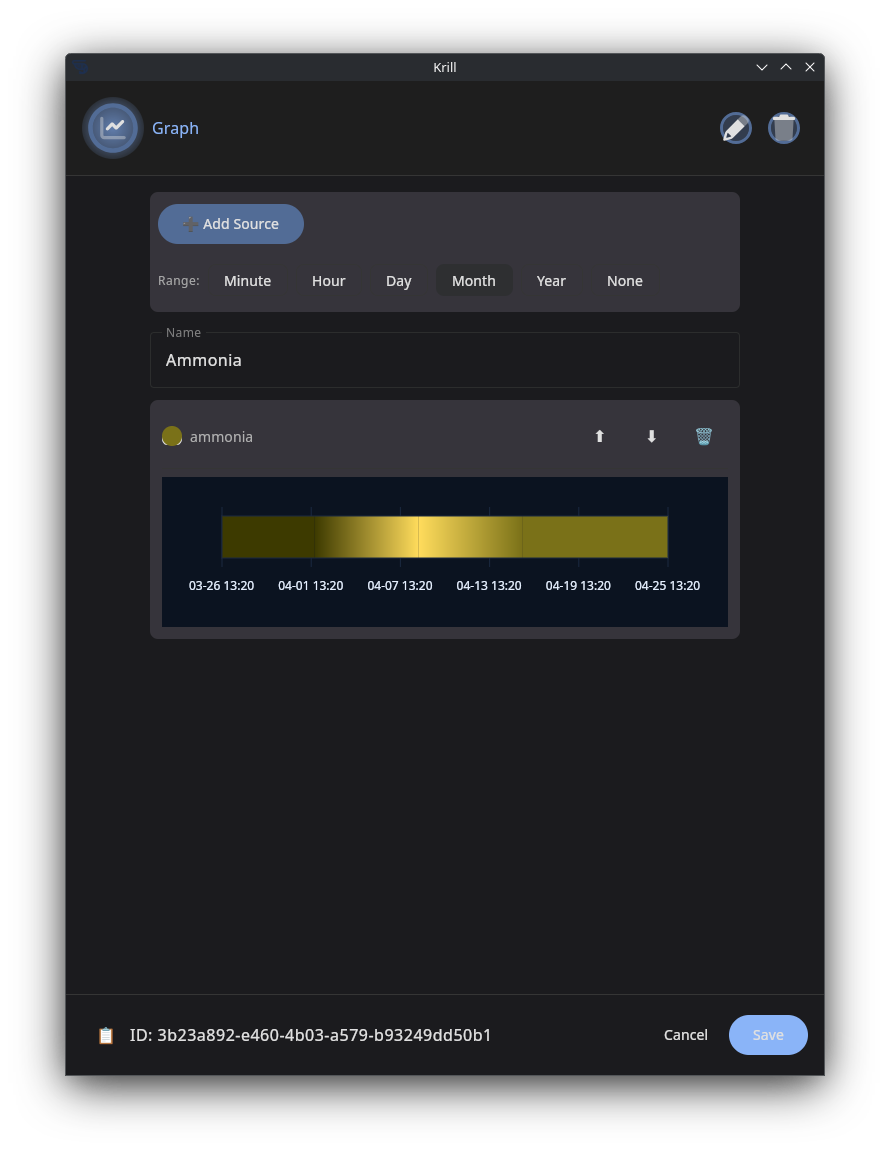
Add a Chart node to the project and connect the COLOR data point to it to see a visual representation of the color changes over time:
As mentioned above, the main swarm screen shows everything happening in your swarm and can get complex with many nodes. It’s great for observing the whole system and catching alerts and problems, but you can create custom dashboards to focus on just the data you care about. Create your dashboards with any SVG editor you like; I use Inkscape, which is free and open source. Add a diagram node, upload the SVG, and bind any node type to rectangle elements whose IDs are prefixed with k_.
Krill will overlay your charts or even nest other diagrams:
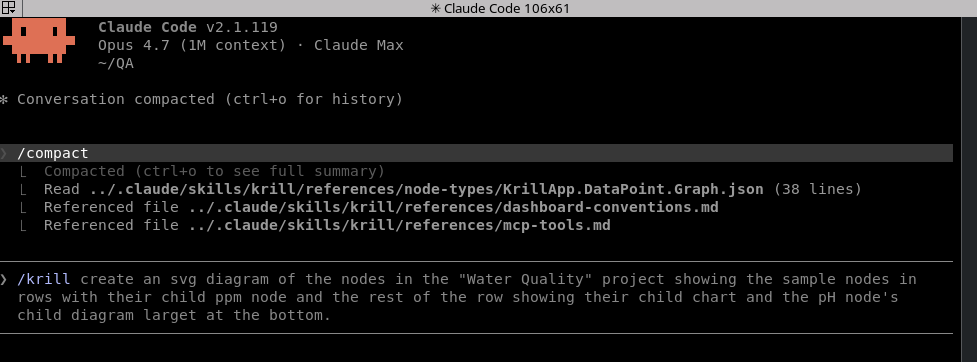
Of course, I can’t take credit for making that diagram — I simply asked Claude to create it and set up the bindings for me using Krill’s MCP server and the Claude Krill Skill 😁
That wraps up part one. In the next post, I’ll show how to automate color data logging using a custom color sensor rig, then use that data to create reminders and alerts.
Related
- CircuitPython Sensors via Lambda — installing Adafruit Blinka, enabling I2C, writing Lambda scripts that read I2C sensors
- Color Data Points and Triggers — the COLOR DataType used for the swatch, and the Color Trigger for RGB-range automation
- Lambda Executor — how Lambda source/target wiring works
- CO2 Reactor with Color Sensor — binary-decision use of the same rig
Draft — last updated 2026-04-26